RZ-G/RZG2 Kernel Debugging with Eclipse and OpenOCD: Difference between revisions
(→OpenOCD dedicated plugin: Added new info) |
(→OpenOCD dedicated plugin: Added video) |
||
| Line 111: | Line 111: | ||
'''Note:''' '''''The board MUST be configured in SCIF download mode (SW11 OFF-ON-OFF-ON) and the user MUST reset the target manually every time, before a debug session is initiated (i.e. before clicking on the "bug" icon).''''' | '''Note:''' '''''The board MUST be configured in SCIF download mode (SW11 OFF-ON-OFF-ON) and the user MUST reset the target manually every time, before a debug session is initiated (i.e. before clicking on the "bug" icon).''''' | ||
Then by launching the debug session (click on the "bug" icon) you should see [https://renesas.info/w/images/b/bc/2024-05-07_11-28-25.mp4 something like this]. | |||
Revision as of 09:41, 7 May 2024
It is possible to use OpenOCD and Eclipse to source level debug the Linux kernel. This means kernel space (device drivers), not application space. For application space, you need to use traditional gdb, not JTAG. The reason is that Linux applications run in virtual address space, so the settings of the MMU must be considered. However, while the Linux kernel also runs at a virtual address, the address space is fixed so it is possible to use openOCD and JTAG.
General Considerations:
Here are some considerations to think
- It is possible to debug a multi-core system [TBA link to the section] but it may be simply easier to disable all other cores.
- This works best for debugging device drivers on bootup.
- It is possible to use gdb from the Yocto SDK, however it is advisable to install a more recent version of the Arm toolchain (e.g. 13.2.Rel1)
Kernel Build Options:
You must build the kernel with the following configuration options. Not that =y means they must be enabled, and =n means they just be disabled. Please use menuconfig to confirm each one.
- CONFIG_DEBUG_INFO=y
- CONFIG_DEBUG_INFO_REDUCED=n
- CONFIG_DEBUG_INFO_SPLIT=n
- CONFIG_RANDOMIZE_BASE=n
- CONFIG_UNMAP_KERNEL_AT_EL0=n
Note that some of these configurations can only be enabled if EXPERT=y.
To debug modules:
- CONFIG_KALLSYMS=y
To make sure the HW breakpoint resources are not touched during boot:
- PERF_EVENTS=n
Because of the default compiler optimization level (-O2), stepping thru the code may be problematic / unpredictable. Using menuconfig you can only select between -O2 and -Os (CC_OPTIMIZE_FOR_PERFORMANCE, CC_OPTIMIZE_FOR_SIZE). There's also a relatively new CC_OPTIMIZE_FOR_PERFORMANCE_O3 to select -O3 but no real way to choose a lower optimization level. It is not mandatory but to get a code flow that is easier to follow, you can manually hack the Makefile and turn -O2 into -O1:
Kernel Boot Arguments:
You need to add the follow to your kernel boot arguments:
- nohlt pti=0 maxcpus=1
The "maxcpus=1" makes sure that even in a multi-core system, only one core is used.
OpenOCD dedicated plugin
It is assumed that Arm Trusted Firmware and u-boot are working and programmed into the chosen boot medium (QSPI, eMMC or SD). It may also be convenient to set-up u-boot to load and boot the kernel via the network (tftp) to make sure that the symbols loaded in gdb always match the kernel that is executed / under debug (in fact the kernel binary is not loaded via JTAG).
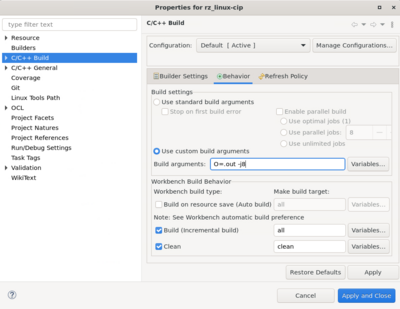
First you need to import the kernel as makefile project (you can also clone and import, similarly to what is documented here). If the toolchain is configured properly before Eclipse is launched, it is possible to build the kernel using the GUI, i.e. by clicking on the hammer icon. The only configuration needed is for the custom build arguments (right click on the project -> Properties -> C/C++ Build -> Behavior tab:
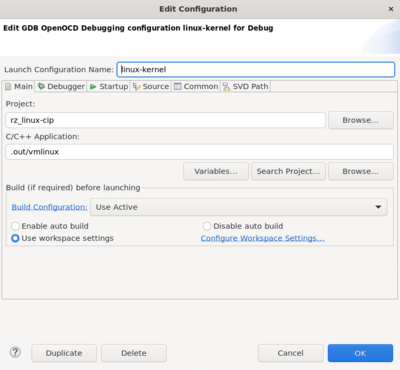
The debug configuration has to be created. Right click on the project -> Debug As - > Debug Configurations. Create a new configuration under "GDB OpenOCD Debugging", name "linux-kernel":
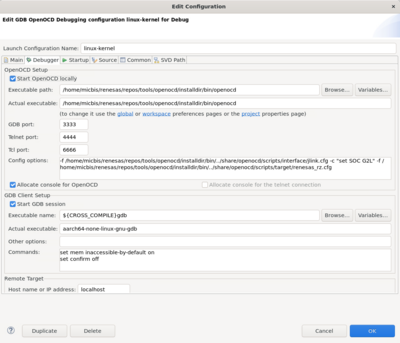
Then the "Debugger" tab (adapt paths to where OpenOCD is installed):
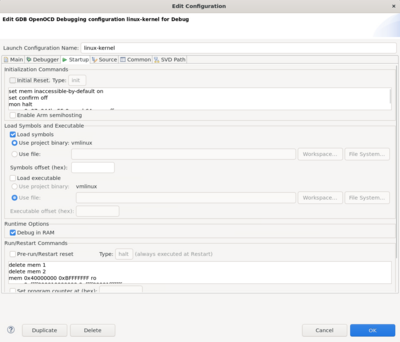
And finally, the most important one is the "Startup" tab:
As explained previously the Initialization Commands depend on the boot media. If the boot medium is QSPI they are:
mon halt
mon r9a07g044l.a55.0 aarch64 smp off
mem 0x0 0x2FFFF ro
set $pc=0x0
rwatch -l *0x11020A00
c
set $x8=0x12003
c
set $x8=0x12003
c
set $x8=0x12003
hbreak *0x4a200000
continue
mem 0x40000000 0xBFFFFFFF rw
add-auto-load-safe-path ~/PATH_TO_BE_CHANGED/rz_linux-cip/.out
If the boot medium is eMMC / SD:
mon halt
mon r9a07g044l.a55.0 aarch64 smp off
mem 0x0 0x2FFFF ro
set $pc=0x0
rwatch -l *0x11020A00
c
set $x8=0x1200n
c
set $x8=0x1200n
c
set $x8=0x1200n
c
set $x0=0x1200n
hbreak *0x4a200000
continue
mem 0x40000000 0xBFFFFFFF rw
add-auto-load-safe-path ~/PATH_TO_BE_CHANGED/rz_linux-cip/.out
where n = 0 for SD and n = 1 or 2 for eMMC 1.8V or 3.3V respectively.
IMPORTANT: it is assumed that in any of the boot modes u-boot is configured such as the kernel binary is loaded (ideally from the network using tftp) at location 0x4A08_0000 and the device tree at location 0x4800_0000, for example:
tftp=tftpboot 0x4A080000 Image; tftpboot 0x48000000 r9a07g044l2-smarc.dtb
Then u-boot would normally move the image from 0x4A08_0000 to 0x4A02_0000, this is where the breakpoint is set in the command list above. For the explanation of the complete list of commands, refer to this page.
The Run/Restart commands are:
delete mem 1
delete mem 2
mem 0x40000000 0xBFFFFFFF ro
mem 0xffff800010000000 0xffff80001fffffff ro
mem 0xffff000000000000 0xffff0000ffffffff rw
thb start_kernel
c
These commands (re)configure the memory regions, note that the 0xffff_0000_0000_0000 - 0xffff_ffff_ffff_ffff virtual address range is what is normally used by the kernel for its own purposes, in contrast with the user space 0x000x_xxxx_xxxx_xxxx (36-bit example).
Note: The board MUST be configured in SCIF download mode (SW11 OFF-ON-OFF-ON) and the user MUST reset the target manually every time, before a debug session is initiated (i.e. before clicking on the "bug" icon).
Then by launching the debug session (click on the "bug" icon) you should see something like this.


