RZ-G/RZG2 Eclipse develop and debug: Difference between revisions
| (21 intermediate revisions by 2 users not shown) | |||
| Line 103: | Line 103: | ||
Give the connection a name and specify the target IP address. User should be ''root''. | Give the connection a name and specify the target IP address. User should be ''root''. | ||
There's only one last field to configure in the "Run Configurations": | There's only one last field to configure in the "Run Configurations": Remote Absolute File Patch for C/C++ Application", click on Browse and leave the default path, then click OK. | ||
Please notice that in order to connect and debug ''openssh, sftp-server'' and ''gdbserver'' must be installed on the target. You can do this by adding following packages in local.conf file in yocto. | Please notice that in order to connect and debug ''openssh, sftp-server'' and ''gdbserver'' must be installed on the target. You can do this by adding following packages in local.conf file in yocto. | ||
<pre> | <pre> | ||
IMAGE_INSTALL_append = " rpm openssh openssh-sftp-server openssh-scp gdbserver" | IMAGE_INSTALL_append = " rpm openssh openssh-sftp-server openssh-scp gdbserver" | ||
</pre> | </pre> | ||
Alternatively, also depending on the Yocto version: | |||
EXTRA_IMAGE_FEATURES ?= "debug-tweaks" | |||
EXTRA_IMAGE_FEATURES += "tools-debug" | |||
IMAGE_INSTALL_append = " openssh-sftp-server" | |||
PACKAGECONFIG_remove_pn-dropbear = " disable-weak-ciphers" | |||
These lines will include all the tools that are normally required for a remote debug. Note that some of these debug tools are under the GPLv3 license, so the corresponding line that is meant to avoid those packages must be commented: | |||
#INCOMPATIBLE_LICENSE = "GPLv3 GPLv3+" | |||
If you click "Run", the application will be deployed and run on the target board. In the console you should see: | If you click "Run", the application will be deployed and run on the target board. In the console you should see: | ||
| Line 137: | Line 144: | ||
Eclipse is useful also to debug bare metal programs in combination with OpenOCD. In this section the [https://github.com/renesas-rz/rzg2_flash_writer RZ/G2 Flash Writer] is taken as an example. | Eclipse is useful also to debug bare metal programs in combination with OpenOCD. In this section the [https://github.com/renesas-rz/rzg2_flash_writer RZ/G2 Flash Writer] is taken as an example. | ||
=== Cloning a repository using Eclipse === | === Cloning a repository using Eclipse === | ||
<hr> | <hr> | ||
| Line 178: | Line 182: | ||
And finally "Check out Commit". A warning about the "Detached HEAD" will appear, you can ignore and click close. Alternatively, and recommended if you want to make changes, you can "Create Branch" window appears, leave it as is and click on "Finish". We need to select the right make command, so right click on the project name -> Properties and then select C/C++ Build. Uncheck "Use default build command" and add/modify BOARD= | And finally "Check out Commit". A warning about the "Detached HEAD" will appear, you can ignore and click close. Alternatively, and recommended if you want to make changes, you can "Create Branch" window appears, leave it as is and click on "Finish". We need to select the right make command, so right click on the project name -> Properties and then select C/C++ Build. Uncheck "Use default build command" and add/modify BOARD=RZG2L_SMARC_PMIC. The message | ||
========== !!! Compile Complete !!! ========== | ========== !!! Compile Complete !!! ========== | ||
should appear if the build is successful. Do not forget to source the right environment variable setup script according to the board used. Please note that you would need to launch Eclipse from the terminal where the environment variables have been set. | should appear if the build is successful. Do not forget to source the right environment variable setup script according to the board used. Please note that you would need to launch Eclipse from the terminal where the environment variables have been set. | ||
=== Debugging Flash Writer using OpenOCD and dedicated plugin === | |||
<hr> | |||
Please follow the instructions given in [[RZ-G/RZG openocd new|this page]] on how to set-up, build and launch OpenOCD for the RZ targets. There is a specific OpenOCD plugin but it is not installed by default with Eclipse. In order to install it, go to Help -> Install New Software. Then select "All Available Sites" and in the filter type "openocd" and hit enter. | |||
[[File:Eclipse install openocd plugin.png|frameless|600x600px]] | |||
Select the plugin and install, at the end of the installation process an Eclipse restart is required. | |||
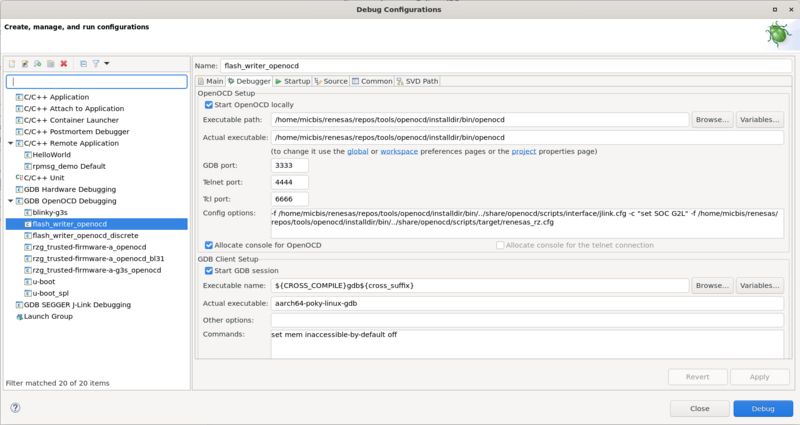
Right click on the project -> Debug As -> Debug Configurations, a new option should be available: "GDB OpenOCD Debugging". Create a new configuration, leave the "Main" tab with the default values and switch to the "Debugger" tab. Here is where you have to configure the link to the OpenOCD executable and the config options, as well as the right GDB executable: | |||
[[File:image fw openocd new.png|frameless|800x800px]] | |||
Adapt to your own paths. The OpenOCD config options for RZ/G2L are: | |||
-f /home/micbis/repos/openocd/installdir/bin/../share/openocd/scripts/interface/jlink.cfg -c "set SOC G2L" -f /home/micbis/repos/openocd/installdir/bin/../share/openocd/scripts/target/renesas_rz.cfg | |||
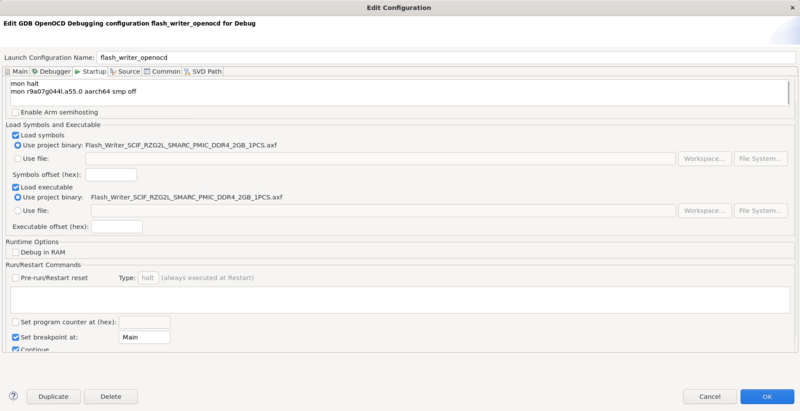
Do not forget to modify the GDB executable name with the environment variable ${CROSS_COMPILE}. Then switch to the "Startup" tab and configure as per below: | |||
[[File:image fw openocd new startup.png|frameless|800x800px]] | |||
Here below the Initialization Commands: | |||
mon halt | |||
mon r9a07g044l.a55.0 aarch64 smp off | |||
'''<u>Note:</u>''' '''<u>''The board MUST be configured in SCIF download mode (SW11 OFF-ON-OFF-ON) and the user MUST reset the target manually every time, before a debug session is initiated (i.e. before clicking on the "bug" icon).''</u>''' | |||
Make sure that also the "Continue" is checked (barely visible in the screenshot, below "Set breakpoint at"). | |||
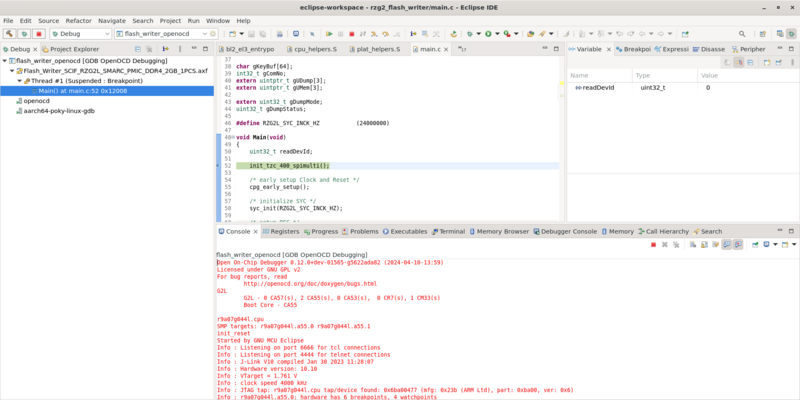
If everything is set properly by clicking on the "bug" icon, OpenOCD is started automatically, code and symbols loaded automatically and therefore you should end up in being able to debug. | |||
[[File:image fw debug new.png|frameless|800x800px]] | |||
'''Note:''' '''''Remove All Breakpoints if something unexpected happens during the launch.''''' | |||
=== Debugging Arm Trusted Firmware BL2 using OpenOCD and dedicated plugin === | |||
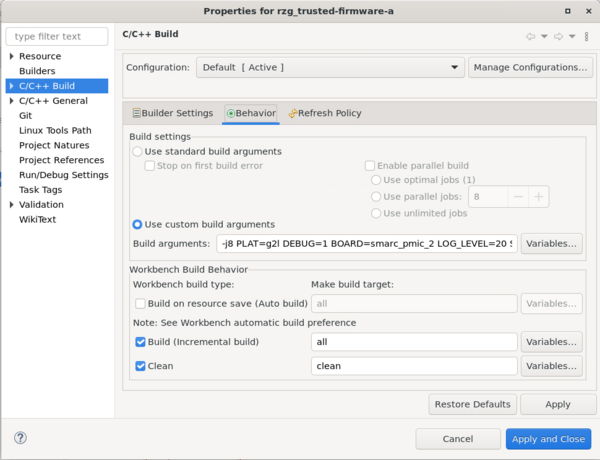
<hr>Similarly to Flash Writer and as much useful, Arm Trusted Firmware BL2 can be debugged using OpenOCD and the dedicated plugin. It is assumed that the plugin is already installed and the repository is already cloned, imported in Eclipse (see previous sections). To build Arm Trusted Firmware in Eclipse with the debug symbols you need to configure the custom build arguments (right click on the project -> Properties -> C/C++ Build -> Behavior tab: | |||
[[File:image ATF build behavior tab.png|frameless|600x600px]] | |||
And these are the build arguments specifically for RZ/G2L (no security, no OP-TEE): | |||
PLAT=g2l DEBUG=1 BOARD=smarc_pmic_2 LOG_LEVEL=20 | |||
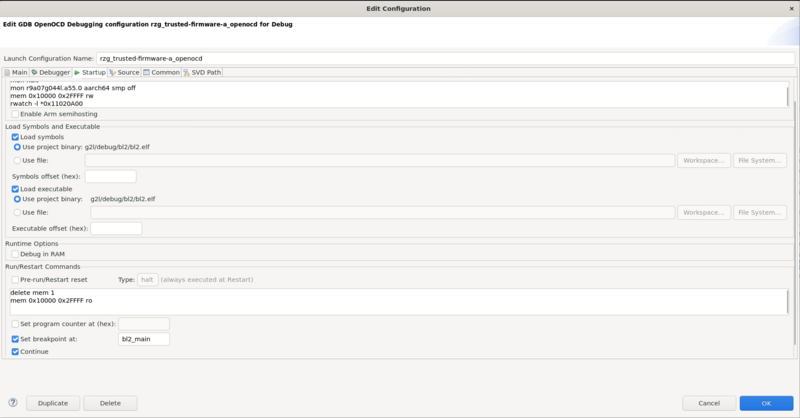
Also the way the debug configuration is created is identical to previous section, the only difference resides in the "Startup" tab": | |||
[[File:image ATF debug configuration startup tab.png|frameless|800x800px]] | |||
Here below the Initialization Commands: | |||
mon halt | |||
mon r9a07g044l.a55.0 aarch64 smp off | |||
mem 0x10000 0x2FFFF rw | |||
rwatch -l *0x11020A00 | |||
'''<u>Note:</u>''' '''<u>''The board MUST be configured in SCIF download mode (SW11 OFF-ON-OFF-ON) and the user MUST reset the target manually every time, before a debug session is initiated (i.e. before clicking on the "bug" icon).''</u>''' | |||
And the Run/Restart Commands: | |||
delete mem 1 | |||
mem 0x10000 0x2FFFF ro | |||
Make sure that also the "Continue" is checked (barely visible in the screenshot, below "Set breakpoint at"). | |||
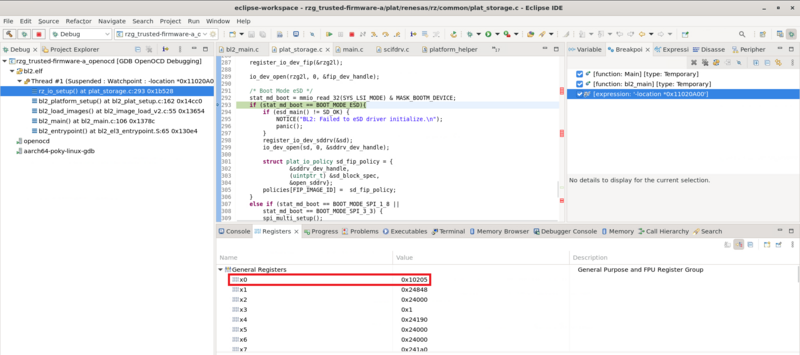
It is important to highlight the importance of the <code>'''rwatch -l *0x11020A00'''</code> initialization command: this configures a watchpoint on a read access to the physical address 0x11020A00, that is the LSI Mode Signal Register (SYS_LSI_MODE). The least significant three bits (STAT_MD_BOOT[2:0]) indicate the terminal state of the external terminal MD_BOOT[2:0], that are updated at the rising edge of PRST#. The RZ ATF custom code checks this bit field to determine what kind of boot mode is and configures the MPU resources accordingly. This is done in the <code>rz_io_setup()</code> function in the <code>plat_storage.c</code> file. Normally by clinking on the "go" button, if there's no other issue before, the watchpoint is hit: | |||
[[File:image atf watchpoint hit high.png|frameless|800x800px]] | |||
'''Note:''' '''''Remove All Breakpoints if something unexpected happens during the launch.''''' | |||
Since we must use the SCIF Download boot mode, the value of this bitfield will always be 5. In order to correctly debug the rest of the code, this value must be changed and adapted to the boot mode of interest: | |||
#define BOOT_MODE_ESD (0) | |||
#define BOOT_MODE_EMMC_1_8 (1) | |||
#define BOOT_MODE_EMMC_3_3 (2) | |||
#define BOOT_MODE_SPI_1_8 (3) | |||
#define BOOT_MODE_SPI_3_3 (4) | |||
#define BOOT_MODE_SCIF (5) | |||
So the x0 register must be manually modified using the debugger to make sure the correct if branch is executed. So, for example, to simulate a boot from SD card, the value of the x0 register shall be changed from 0x10205 to 0x10200. | |||
=== Debugging Arm Trusted Firmware BL31 using OpenOCD and dedicated plugin === | |||
<hr>BL31 (also known as Secure Monitor) is built along with BL2 and it can also be debugged with OpenOCD and Eclipse. | |||
[[RZ-G/RZ-G2 BSP Porting|BL3x are loaded by BL2]] and BL31 is the second user piece of code that is executed after BL2. So <u>it is assumed that BL2 is working (i.e. already ported) and programmed into the boot media (QSPI, eMMC or SD) along with all other BL3x</u>. It does not really matter if they are not completely working, it's just to ensure that something can be loaded by BL2 and the execution can be passed to the following boot stages. The idea is to let BL2 execute, load next stage bootloaders, then break at the entry point and finally load the code to be debugged into RAM. | |||
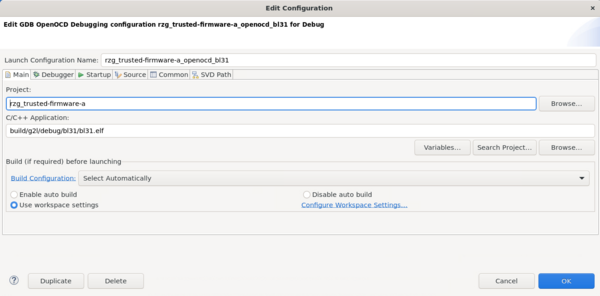
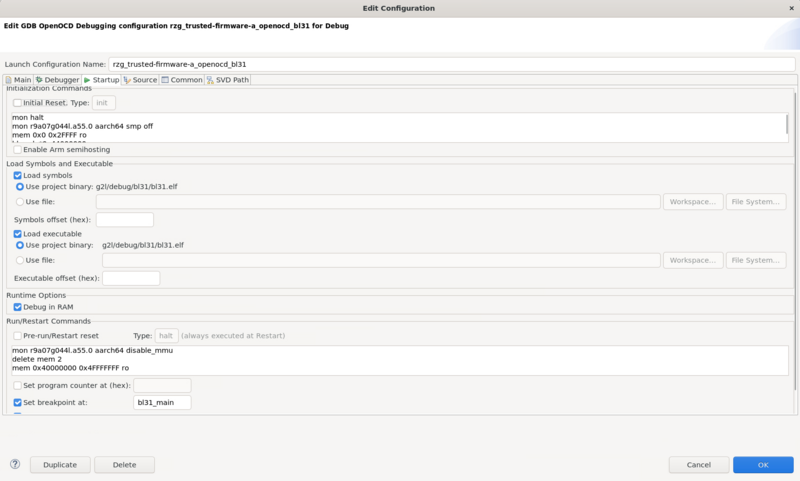
We need to create a debug configuration for BL31, similarly to what is explained in the previous sections: | |||
[[File:image BL31 Main debug config.png|frameless|600x600px]] | |||
[[File:image Bl31 Startup config2.png|frameless|800x800px]] | |||
The "Continue" box is also checked (barely visible in the screenshot). | |||
'''Note:''' '''''The board MUST be configured in SCIF download mode (SW11 OFF-ON-OFF-ON) and the user MUST reset the target manually every time, before a debug session is initiated (i.e. before clicking on the "bug" icon).''''' | |||
If the '''boot media is QSPI''', the initialization commands are: | |||
mon halt | |||
mon r9a07g044l.a55.0 aarch64 smp off | |||
mem 0x0 0x2FFFF ro | |||
hbreak *0x44000000 | |||
set $pc=0x0 | |||
rwatch -l *0x11020A00 | |||
c | |||
set $x8=0x12003 | |||
c | |||
set $x8=0x12003 | |||
c | |||
set $x8=0x12003 | |||
shell sleep 1 | |||
continue | |||
mem 0x40000000 0x4FFFFFFF rw | |||
These commands may need a bit of explanation. | |||
<code>mem 0x0 0x2FFFF</code> ro is required to make sure that the ROM and internal SRAM are treated as ro memory. GDB will then try to use hardware breakpoints to step / go / break. | |||
<code>hbreak *0x44000000</code> - this sets a hardware breakpoint at the BL31 default entry point location. Usually there is no need to change it, however the breakpoint may need to be moved if this BL31 is located somewhere else. | |||
set $pc=0x0 - this sets the program counter back to the first location of the ROM, basically the reset vector. | |||
<code>rwatch -l *0x11020A00</code> - this command was explained in the previous section. It configures a watchpoint on a read access to the physical address 0x11020A00, that is the LSI Mode Signal Register (SYS_LSI_MODE). | |||
<code>c</code> and <code>set $x8=0x12003</code> repeated <u>3 times</u>. In the ROM code the SYS_LSI_MODE register is read three times, each time the value read has to be modified to reflect the boot mode we are emulating, so the final 3 means QSPI 1.8V boot mode. | |||
<code>mem 0x40000000 0x4FFFFFFF rw</code> - this command configures a memory page for the DDR, where the BL31 code resides. | |||
If the '''boot media is eMMC/SD''', the initialization commands are: | |||
mon halt | |||
mon r9a07g044l.a55.0 aarch64 smp off | |||
mem 0x0 0x2FFFF ro | |||
hbreak *0x44000000 | |||
set $pc=0x0 | |||
rwatch -l *0x11020A00 | |||
c | |||
set $x8=0x1200'''n''' | |||
c | |||
set $x8=0x1200'''n''' | |||
c | |||
set $x8=0x1200'''n''' | |||
c | |||
set $x0=0x1200'''n''' | |||
shell sleep 1 | |||
continue | |||
mem 0x40000000 0x4FFFFFFF rw | |||
where <u>n = 0 for SD and n = 1 or 2 for eMMC 1.8V or 3.3V respectively</u>. Note that in case of booting from eMMC or SD the sequence is repeated 4 times, because this is there is an additional check done in BL2. | |||
The Run/Restart commands are: | |||
mon r9a07g044l.a55.0 aarch64 disable_mmu | |||
delete mem 2 | |||
mem 0x40000000 0x4FFFFFFF ro | |||
<code>mon r9a07g044l.a55.0 aarch64 disable_mmu</code> - this command makes sure that the code loaded via JTAG is correctly reflected into the DDR, by cleaning / invalidating the data cache, invalidating the instruction cache and executing ISB / DSB. | |||
<code>mem 0x40000000 0x4FFFFFFF ro</code> - along with the previous (<code>delete mem 2</code>) this ensures that HW breakpoints are used for the DDR region we are debugging. Probably not strictly required but is may be better for the stability. | |||
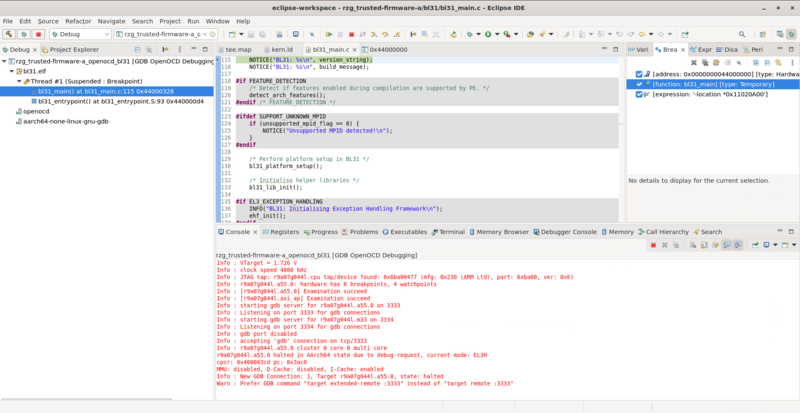
Then, finally the debug session looks like: | |||
[[File:image BL31 debug.png|frameless|800x800px]] | |||
'''Note:''' '''''Remove All Breakpoints if something unexpected happens during the launch.''''' | |||
=== Debugging u-boot (BL33) using OpenOCD and dedicated plugin === | |||
<hr>If there's no BL32 (OP-TEE), u-boot is the code executed next. | |||
As explained in the previous section, [[RZ-G/RZ-G2 BSP Porting|BL3x are loaded by BL2]]. I<u>t is assumed that BL2 is working (i.e. already ported) and programmed into the boot media (QSPI, eMMC or SD) along with all other BL3x</u>. It does not really matter if they are not completely working, it's just to ensure that something can be loaded by BL2 and the execution can be passed to the following boot stages. The idea is to let BL2 execute, load next stage bootloaders, then break at the entry point and finally load the code to be debugged into RAM. | |||
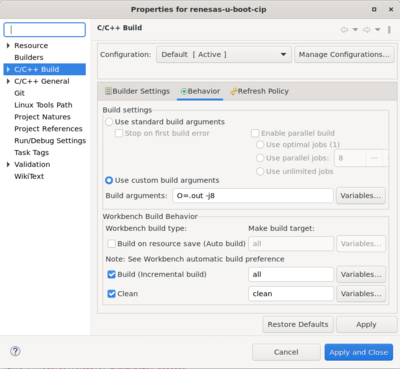
u-boot can be imported (see Flash Writer section for more details) and built using Eclipse. Assuming it is already configured properly for the target device, the toolchain is properly set up before running Eclipse, then the only configuration needed is for the custom build arguments (right click on the project -> Properties -> C/C++ Build -> Behavior tab: | |||
[[File:image uboot build arguments.png|frameless|400x400px]] | |||
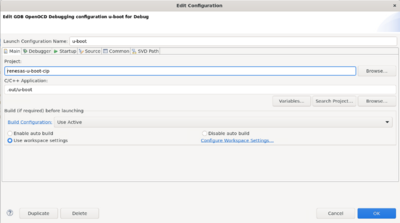
Let's create the debug configuration, Main tab: | |||
[[File:image uboot debug config main.png|frameless|400x400px]] | |||
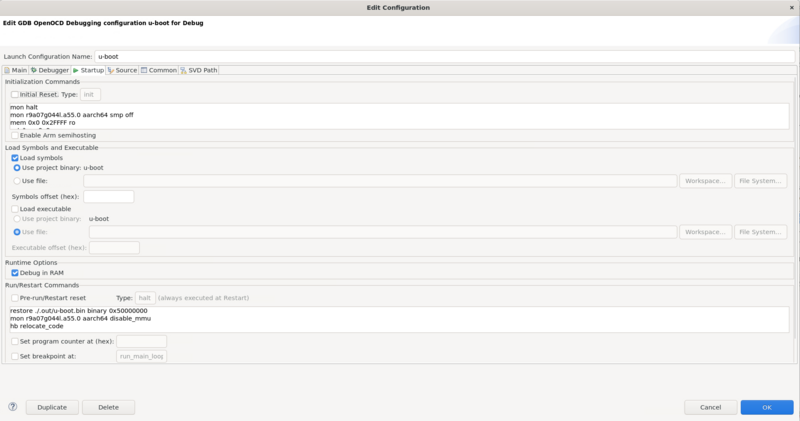
Then Startup tab: | |||
[[File:image_uboot_debug_config_startup.png|frameless|800x800px]] | |||
As explained in the previous section the Initialization Commands depend on the boot media. If the '''boot media is QSPI''' they are: | |||
= | mon halt | ||
mon r9a07g044l.a55.0 aarch64 smp off | |||
mem 0x0 0x2FFFF ro | |||
set $pc=0x0 | |||
rwatch -l *0x11020A00 | |||
c | |||
set $x8=0x12003 | |||
c | |||
set $x8=0x12003 | |||
c | |||
set $x8=0x12003 | |||
hbreak *0x50000000 | |||
continue | |||
mem 0x50000000 0xBFFFFFFF rw | |||
If the boot media is eMMC / SD: | |||
mon halt | |||
mon r9a07g044l.a55.0 aarch64 smp off | |||
mem 0x0 0x2FFFF ro | |||
set $pc=0x0 | |||
rwatch -l *0x11020A00 | |||
c | |||
set $x8=0x1200n | |||
c | |||
set $x8=0x1200n | |||
c | |||
set $x8=0x1200n | |||
c | |||
set $x0=0x1200n | |||
hbreak *0x50000000 | |||
continue | |||
mem 0x50000000 0xBFFFFFFF rw | |||
where <u>n = 0 for SD and n = 1 or 2 for eMMC 1.8V or 3.3V respectively</u>. Note again that in case of booting from eMMC or SD the sequence <code>c</code> <code>set $x8=0x1200n</code> is repeated 4 times instead of 3 as per QSPI boot, because this is there is an additional check done in BL2. | |||
The Run/Restart Commands are: | |||
restore ./.out/u-boot.bin binary 0x50000000 | |||
mon r9a07g044l.a55.0 aarch64 disable_mmu | |||
hb relocate_code | |||
c | |||
shell sleep 1 | |||
symbol-file ./.out/u-boot -o gd->reloc_off | |||
shel sleep 1 | |||
hb run_main_loop | |||
In the Startup screenshot note that the "Load executable" flag is not checked. This is because u-boot is loaded to some location in memory and then it relocates itself. | |||
<code>restore ./.out/u-boot.bin binary 0x50000000</code> - this command loads the u-boot binary onto DDR, at location 0x50000000. | |||
<code>hb relocate_code</code> - this sets a breakpoint to the relocate_code function in u-boot (symbols are already loaded). | |||
<code>symbol-file ./.out/u-boot -o gd->reloc_off</code> - this command relocates the symbols to where u-boot relocates, <code>gd -> gd->reloc_off</code> is the offset. | |||
<code>hb run_main_loop</code> - this is the breakpoint to the main loop address, where u-boot has been relocated. | |||
'''Note:''' '''''The board MUST be configured in SCIF download mode (SW11 OFF-ON-OFF-ON) and the user MUST reset the target manually every time, before a debug session is initiated (i.e. before clicking on the "bug" icon).''''' | |||
Finally, hitting the "bug" icon: | |||
[[File:image uboot debug main loop.png|frameless|800x800px]] | |||
'''Note:''' '''''Remove All Breakpoints if something unexpected happens during the launch.''''' | |||
=== Debugging u-boot SPL (Secondary Program Loader) using OpenOCD using dedicated plugin === | |||
<hr>RZ/Five does not use Arm Trusted Firmware and the first boot loader is u-boot SPL (more information [[RZ-Five/RZ-Five-BSP Porting#Overview|here]]). | |||
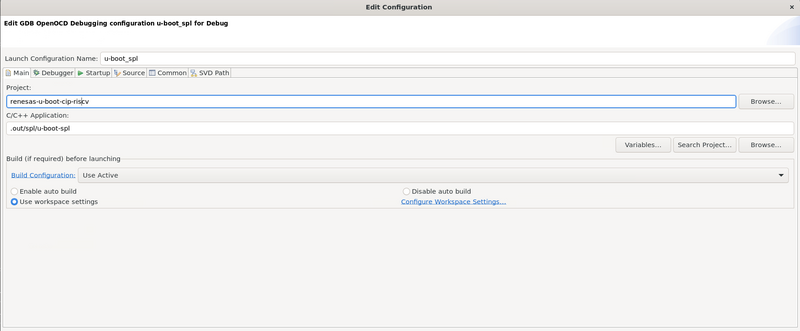
You can clone the [https://github.com/renesas-rz/renesas-u-boot-cip u-boot repository], select the right branch and build in a similar way explained in the previous sections, the only difference is that a [[RZ-Five/RZ-Five-BSP Porting#Toolchain|different toolchain]] is required. Assuming u-boot and u-boot SPL are built correctly, you can create a debug configuration in the same way as described before: | |||
[[File:Eclipse | [[File:Eclipse openocd plugin debug conf riscv1.png|frameless|800x800px]] | ||
Project name chosen: renesas-u-boot-cip-riscv. | |||
[[File:Eclipse openocd plugin debug conf riscv2.png|frameless|800x800px]] | |||
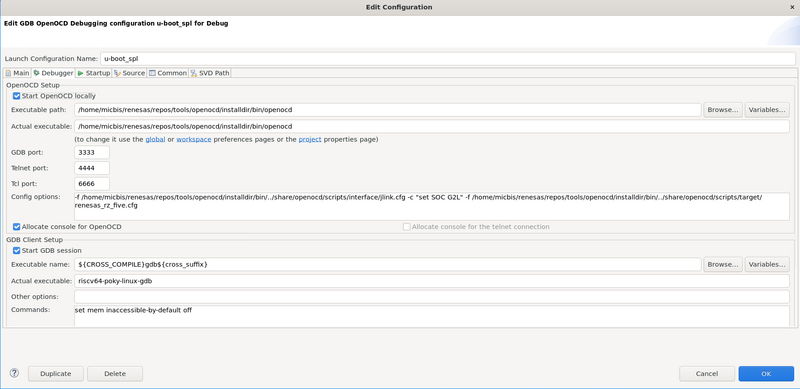
Config options reported here: | |||
-f /home/micbis/renesas/repos/tools/openocd/installdir/bin/../share/openocd/scripts/interface/jlink.cfg -c "set SOC G2L" -f /home/micbis/renesas/repos/tools/openocd/installdir/bin/../share/openocd/scripts/target/renesas_rz_five.cfg | |||
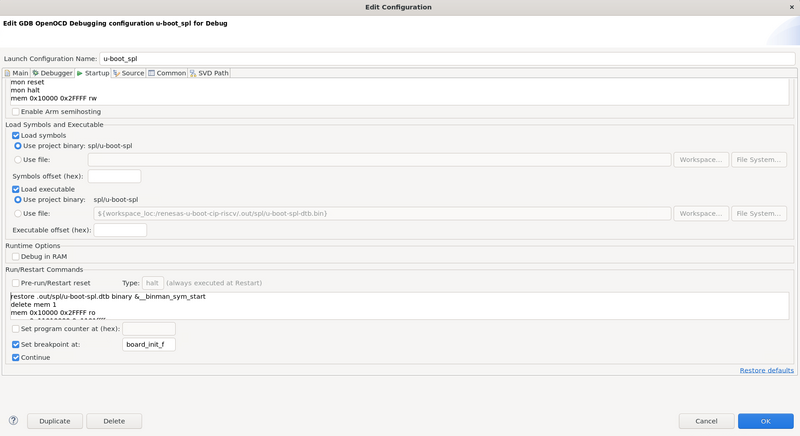
And finally startup tab: | |||
[[File:Eclipse openocd plugin debug conf riscv3.png|frameless|800x800px]] | |||
Initialization Commands: | |||
mon reset | |||
mon halt | |||
mem 0x10000 0x2FFFF rw | |||
Run/Restart Commands: | |||
restore .out/spl/u-boot-spl.dtb binary &__binman_sym_start | |||
delete mem 1 | |||
mem 0x10000 0x2FFFF ro | |||
mon mww 0x10000 0x1 | |||
There's an important difference here to highlight compared to Arm Trusted Firmware BL2. Since u-boot-spl (elf file) does not include the device tree blob (u-boot-spl.dtb), it needs to be downloaded to memory explicitly at a specific memory location, the address of the __binman_sym_start symbol. | |||
The last command in the Run/Restart is meant to simulate the value that the boot ROM writes at 0x10000 SRAM location, reading the BOOT_SELn pins configuration at startup (refer to the table in the previous section). | |||
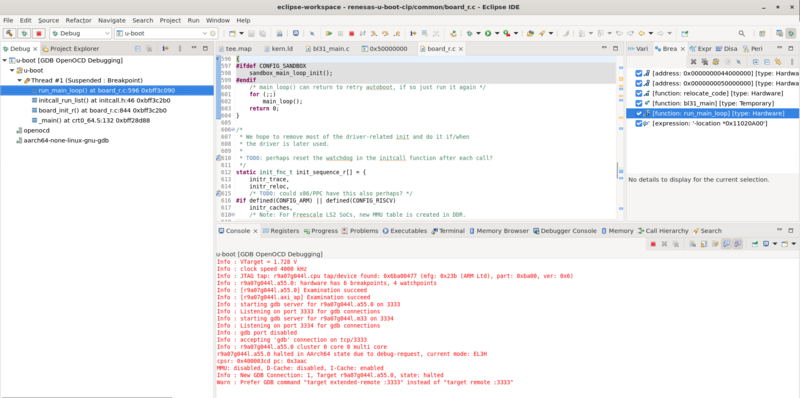
Once saved, if everything goes fine, u-boot-spl can be debugged by clicking on the bug icon in Eclipse, leading to something similar to the following screenshot: | |||
[[File:Eclipse openocd plugin debug ok riscv.png|frameless|800x800px]] | |||
== Secondary cores cross developing and debugging == | == Secondary cores cross developing and debugging == | ||
The RZ/G2 family includes a secondary, real-time core. The RZ/G2L include a Cortex-M33 whereas RZ/G2E-N-M-H include a Cortex-R7. You can use Eclipse to develop and debug also for these cores. Debugging is a little tricky because the secondary core cannot boot independently, rather it relies on the main core to load the firmware and boot. However the idea behind does not change much, you need to setup a development environment for the Cortex-M/R (e.g. arm-none-eabi-gcc ) and use the corresponding GDB to debug (arm-none-eabi-gdb). GDB connects to the OpenOCD port dedicated to the secondary core. You can also develop and debug both main cores and secondary cores at the same time, using two Eclipse instances. | The RZ/G2 family includes a secondary, real-time core. The RZ/G2L include a Cortex-M33 whereas RZ/G2E-N-M-H include a Cortex-R7. You can use Eclipse to develop and debug also for these cores. Debugging is a little tricky because the secondary core cannot boot independently, rather it relies on the main core to load the firmware and boot. However the idea behind does not change much, you need to setup a development environment for the Cortex-M/R (e.g. arm-none-eabi-gcc ) and use the corresponding GDB to debug (arm-none-eabi-gdb). GDB connects to the OpenOCD port dedicated to the secondary core. You can also develop and debug both main cores and secondary cores at the same time, using two Eclipse instances. | ||
| Line 371: | Line 588: | ||
<hr> | <hr> | ||
To do. | To do. | ||
= Kernel Debugging with Eclipse and OpenOCD = | |||
It is possible to use OpenOCD and Eclipse to source level debug the Linux kernel. This means '''kernel space''' (device drivers), not application space. For application space, you need to use traditional gdb, not JTAG. The reason is that Linux applications run in virtual address space, so the settings of the MMU must be considered. However, while the Linux kernel also runs at a virtual address, the address space is fixed so it is possible to use openOCD and JTAG. | |||
<br> | |||
'''General Considerations:''' | |||
Here are some considerations to think | |||
* The JTAG can only break and control CPU core 0. If you use a multi-core system, you must disable all other cores. | |||
* This works best for debugging device drivers on bootup. | |||
* Please make and install the Yocto SDK because we will need to use the gdb from that SDK. | |||
<br> | |||
'''Kernel Build Options:''' | |||
You must build the kernel with the following configuration options. Not that =y means they must be enabled, and =n means they just be disabled. Please use menuconfig to confirm each one. | |||
* CONFIG_DEBUG_INFO=y | |||
* CONFIG_DEBUG_INFO_REDUCED=n | |||
* CONFIG_DEBUG_INFO_SPLIT=n | |||
* CONFIG_RANDOMIZE_BASE=n | |||
* CONFIG_UNMAP_KERNEL_AT_EL0=n | |||
To debug modules: | |||
* CONFIG_KALLSYMS=y | |||
<br> | |||
'''Kernel Boot Arguments:''' | |||
You need to add the follow to your kernel boot arguments: | |||
* nohlt pti=0 maxcpus=1 | |||
<br> | |||
'''GDB init script:''' | |||
* Create a script file 'gdb_g2l_kernel' with the contents below. This script will get run by eclipse. | |||
<pre> | |||
# This script is meant to debug the RZ/G2L kernel | |||
# Connect to OpenOCD | |||
# If the script is launched from GDB command line then the next line shall not be commented out | |||
# In Eclipse it is not needed since the connection is attempted by Eclipse itself | |||
#target remote localhost:3333 | |||
set confirm off | |||
mon reset | |||
mon halt | |||
shell sleep 0.5 | |||
# Disable SMP | |||
mon r9a07g044l.a55.0 aarch64 smp off | |||
shell sleep 0.5 | |||
# Add DDR memory region | |||
mem 0x40000000 0xBFFFFFFF ro | |||
# Add kernel DDR memory region | |||
# Set at Read-only to force only HW breakpoints | |||
mem 0xffff800010000000 0xffff80001fffffff ro | |||
# Set a temporary breakpoint at function start_kernel(). | |||
# You can remove this | |||
thbreak start_kernel | |||
continue | |||
</pre> | |||
<br> | |||
'''Board Setup:''' | |||
* You boot the board normally into u-boot. The start script will set a hardware breakpoint in start_kernel for you, so Eclipse will automatically stop on boot. | |||
<br> | |||
'''Eclipse Project:''' | |||
* Create a new "Makefile Project with Existing Code" | |||
* Browse to the base of you kernel source code. | |||
Eclipse Debugger Configuration: | |||
* Create a new 'GDB Hardware Debugging' Configuration | |||
* Fill in the tabs as follows: | |||
<pre> | |||
[Main] | |||
Project: rz_linux_cip | |||
C/C++ Application: /home/renesas/rzg/rzg2l/build_scripts/rz_linux-cip/.out/vmlinux | |||
[x] Disable auto build | |||
[Debugger] | |||
[Debugger][GDB Setup] | |||
GDB Command: /opt/poky/3.1.17/sysroots/x86_64-pokysdk-linux/usr/bin/aarch64-poky-linux/aarch64-poky-linux-gdb | |||
[Debugger][Remote Target] | |||
Use Remote target | |||
[x] User remote target | |||
[ ] Remote timeout (seconds): | |||
JTAG Device: [ OpenOCD (via socket) ] | |||
GDB Conenciton String: [ localhost:3333 ] | |||
[ ] Force thread list update on suspend | |||
[Startup] | |||
[Initialization Commands] | |||
[x] Reset and Delay (seconds) 1 | |||
[ ] Halt | |||
---------------------------------------------------------- | |||
| source gdb_g2l_kernel | | |||
---------------------------------------------------------- | |||
[Load Images and Symbols] | |||
[ ] Load images | |||
[X] Load symbols | |||
(o) Use project binary: xxxxxxxxxxxxxx | |||
( ) Use File: | |||
Run Commands | |||
[ ] Set program counter at (hex) | |||
[ ] Set breakpoint at: | |||
</pre> | |||
<br> | |||
'''Eclipse Considerations:''' | |||
* The ''''Step Over'''' button does not work well. But, you can use ''''Run to Line'''' which works well. | |||
* The ''''Step Into'''' button does not work well. However, if you enable the ''''Instruction Stepping Mode'''', then the 'Step Into' button does work because then it will use the 'si' gdb command and step each assembly instruction (as opposed to C instruction which requires a breakpoint) one at a time. In that case, you can watch each step operation in the Disassembly window. | |||
Latest revision as of 12:53, 19 April 2024
Introduction
In this page you'll find instructions on how to use Eclipse to develop, cross-build and debug for RZ/G2. Eclipse is a very well known IDE (Integrated Development Environment) that can be used to develop for different targets, supporting many programming languages.
Installation
- There are many guides available online that describe how to install Eclipse on your host Linux machine, normally an x86 PC.
- For example, if you are using Ubuntu 20.04, you can follow the instructions included on this web page.
- When you do launch eclipse, if you get an error saying your Java is too old, you can follow these instructions here. Please note that after you install a new Java version, you will have to change the default to that one using the command "sudo update-alternatives --config java".
$ java -version                              # Check what version is currently selected
$ sudo apt install openjdk-16-jre            # Install a new version
$ sudo update-alternatives --config java     # Set this new version as the default (select option '0')
$ java -version                              # Check what version is currently selected
- ⚠️ Before launching Eclipse, we need to set up some system environment variables for cross compiling. This is discussed below.
Setting up the cross-build environment
Since the goal is to develop for RZ/G2 that are SoCs based on 64-bit Arm Cortex-A cores, you need to install the SDK. For more information on how to build and install the SDK for RZ/G2 you can normally refer to the Release Note of the BSP, the links can be found here. Once the SDK is installed, you have to setup the environment by launching the related script. The default installation path is: /opt/poky/[version] so, for example, in order to setup the environment to cross-build for RZ/G2L:
source /opt/poky/3.1.5/environment-setup-aarch64-poky-linux
If successful, you should be able to invoke the cross-compiler:
$ $CC --version
aarch64-poky-linux-gcc (GCC) 8.3.0
Copyright (C) 2018 Free Software Foundation, Inc.
This is free software; see the source for copying conditions.  There is NO
warranty; not even for MERCHANTABILITY or FITNESS FOR A PARTICULAR PURPOSE.
and also other tools like GDB. These system environment variables will be used by Eclipse.
Launching Eclipse
- We are now ready to launch Eclipse. From the same terminal where you sourced the environment variable script just type:
eclipse &
- When you launch Eclipse for the first time, it asks to set-up a workspace, after that you should see a Welcome screen:

First Linux cross application: Hello World
- In order to create your first Hello World program, click File -> New -> C/C++ Project
- Select C Managed Build
- In the [C Project] window
- Project name: (give it a name such as Hello World)
- Project Type: Executable / Hello World ANSI C Project
- Toolchains: Cross GCC
- In the [Basic Settings] window
- Enter what you want.
- In the [Select Configurations] window
- Select all
- In the [Cross GCC Command] window
- Cross compiler prefix: aarch64-poky-linux-
- Cross compiler path: /usr/bin
- When you click Finish, a new project with the name given will be created.
- In order to get it correctly built, you need to adjust some build settings
- Right click on the project, then select Properties.
- When the setting windows pop-up, expand C/C++ Build and select Settings.
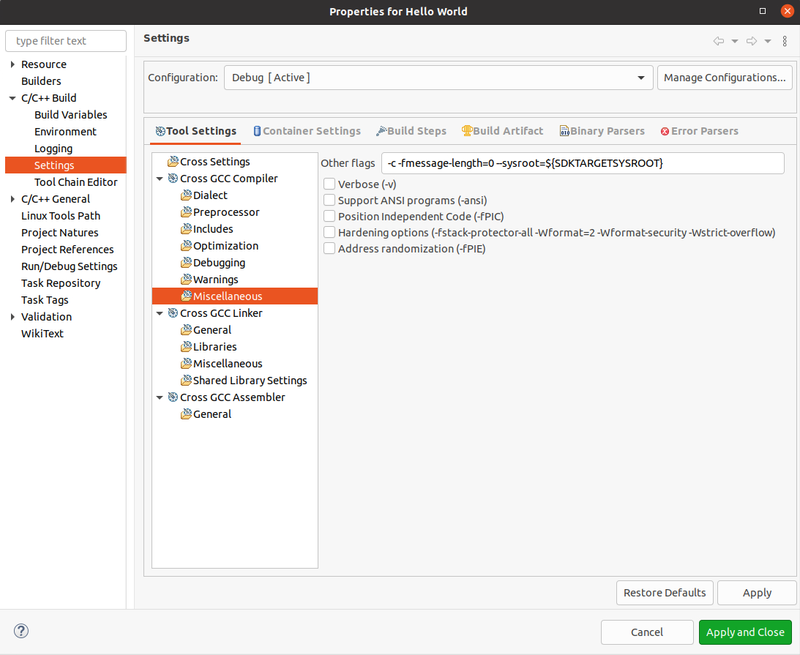
- Expand Cross GCC Compiler and select Miscellaneous. To "Other flags", add at the end --sysroot=${SDKTARGETSYSROOT}.
- Expand Cross GCC Linker and select Miscellaneous.Add flags --sysroot=${SDKTARGETSYSROOT}
- Click 'Apply and Close'
- If you now click on the hammer icon on the top left, you should be able to build the project. If successful on the console you will get:
12:04:50 **** Build of configuration Debug for project Hello World ****
make all
Building file: ../src/Hello World.c
Invoking: Cross GCC Compiler
aarch64-poky-linux-gcc -O0 -g3 -Wall -c -fmessage-length=0 --sysroot=/opt/poky/3.1.5/sysroots/aarch64-poky-linux -MMD -MP -MF"src/Hello World.d" -MT"src/Hello\ World.d" -o "src/Hello World.o"
"../src/Hello World.c"
Finished building: ../src/Hello World.c

Building target: Hello World
Invoking: Cross GCC Linker
aarch64-poky-linux-gcc --sysroot=/opt/poky/3.1.5/sysroots/aarch64-poky-linux -o "Hello World"  ./src/Hello\ World.o
Finished building target: Hello World

12:04:50 Build Finished. 0 errors, 0 warnings. (took 168ms)
Cross debugging a Linux application over the network using GDB
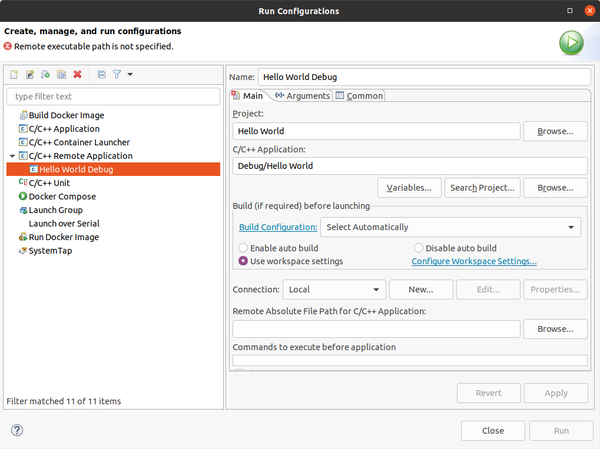
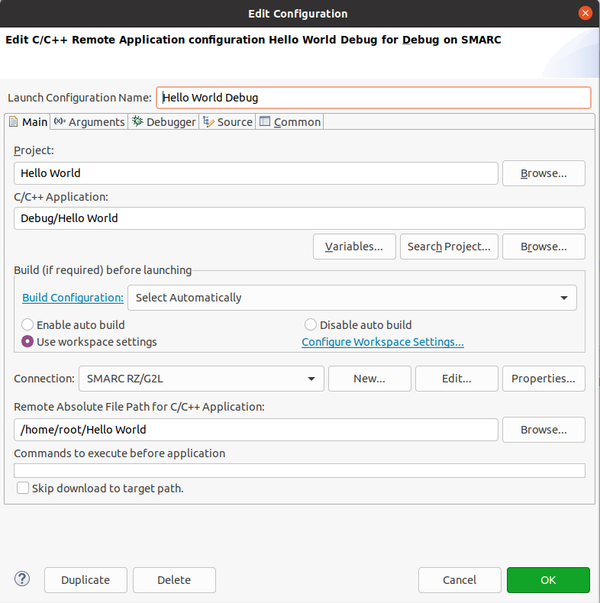
Now we are ready to debug. Click Run -> Run Configurations, then select (double click) on C/C++ Remote Application, you can leave the default name or choose what you want.
Then click "New" button (corresponding to Connection), choose "SSH", then "OK":
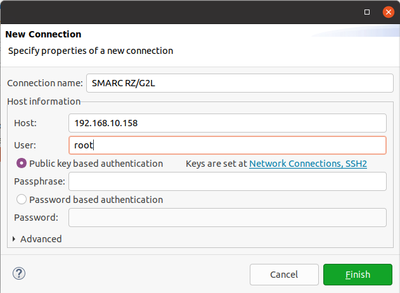
Give the connection a name and specify the target IP address. User should be root. There's only one last field to configure in the "Run Configurations": Remote Absolute File Patch for C/C++ Application", click on Browse and leave the default path, then click OK. Please notice that in order to connect and debug openssh, sftp-server and gdbserver must be installed on the target. You can do this by adding following packages in local.conf file in yocto.
IMAGE_INSTALL_append = " rpm openssh openssh-sftp-server openssh-scp gdbserver"
Alternatively, also depending on the Yocto version:
EXTRA_IMAGE_FEATURES ?= "debug-tweaks"
EXTRA_IMAGE_FEATURES += "tools-debug"
IMAGE_INSTALL_append = " openssh-sftp-server"
PACKAGECONFIG_remove_pn-dropbear = " disable-weak-ciphers"
These lines will include all the tools that are normally required for a remote debug. Note that some of these debug tools are under the GPLv3 license, so the corresponding line that is meant to avoid those packages must be commented:
#INCOMPATIBLE_LICENSE = "GPLv3 GPLv3+"
If you click "Run", the application will be deployed and run on the target board. In the console you should see:
/home/root/Hello\ World;exit

Last login: Tue Jun  1 11:36:17 2021 from 192.168.10.118

root@smarc-rzg2l:~# /home/root/Hello\ World;exit
!!!Hello World!!!
logout
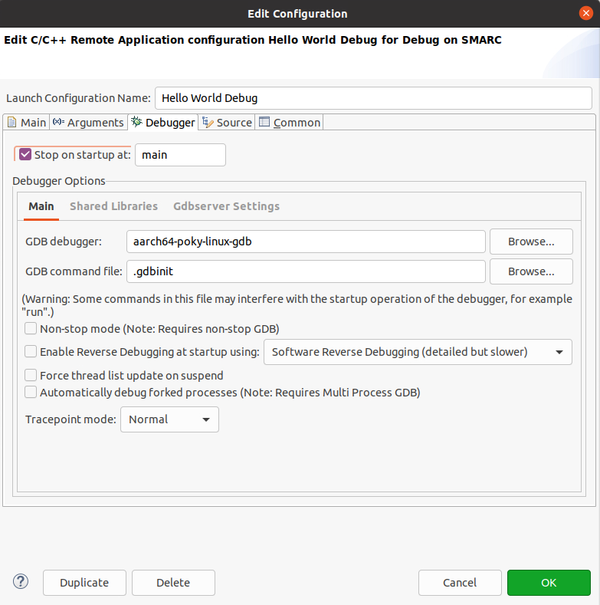
To debug, instead, you have to adjust one more parameter. Select "Debug" from the drop down list (instead on "Run"). Then click on the gear corresponding to "Hello World Debug" (or the name you gave):
Switch to the Debugger Tab and select the cross GDB included in the SDK, aarch64-poky-linux-gdb:
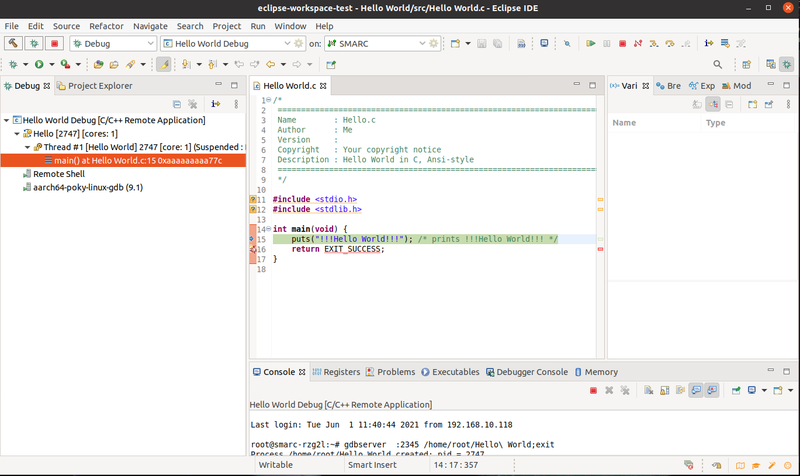
Note: If an error pops up when trying to modify the debug configuration, then you need to add a new "Launch Target". Normally it should not be strictly needed but without at least a target it may not work. At this point you should be able to debug by simply clicking on the "bug" icon, the binary will be downloaded into the target and run under GDB control":
Cross debugging bare metal programs using GDB and OpenOCD
Eclipse is useful also to debug bare metal programs in combination with OpenOCD. In this section the RZ/G2 Flash Writer is taken as an example.
Cloning a repository using Eclipse
Eclipse includes a plugin for a seamless integration with Git. You can clone and import at the same time. Click File -> Import -> Git -> Projects from Git (with smart import). Then Clone URI, then paste the RZ/G2 Flash Writer GitHub link:
https://github.com/renesas-rz/rzg2_flash_writer
into Location (URI). Then by clicking next, the Branch Selection window appears, select both "master" and "rz_g2l" (default). Then you are prompted to choose a destination folder, choose where the repository will be cloned and click Next. Now we want to import the project using another wizard, so we have to click on "Show other specialized import wizards".
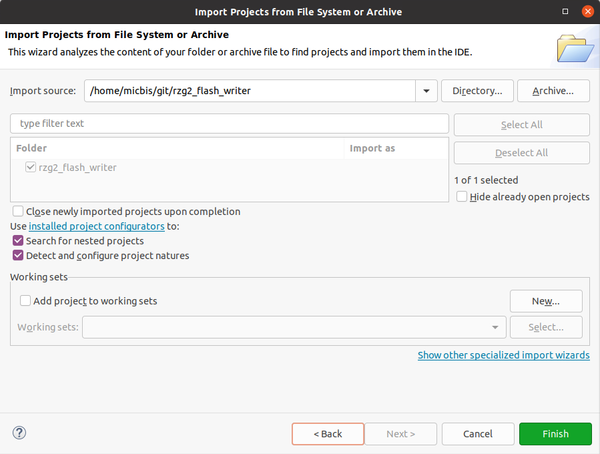
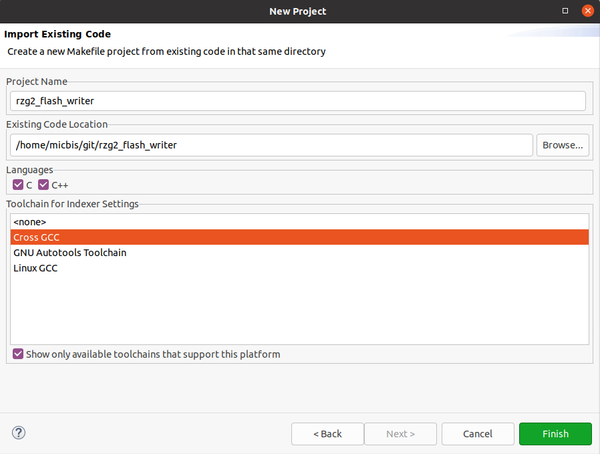
When the other import wizard window appears, select from the C/C++ category, "Existing Code as Makefile Project" and click Next. Browse to the code location where you cloned the repository, select the folder (Open) and finally select "Cross GCC" before clicking Finish:
You should now have the project cloned from the repository, on the master branch and imported as a Makefile project.
Building RZ/G2E-N-M-H Flash Writer
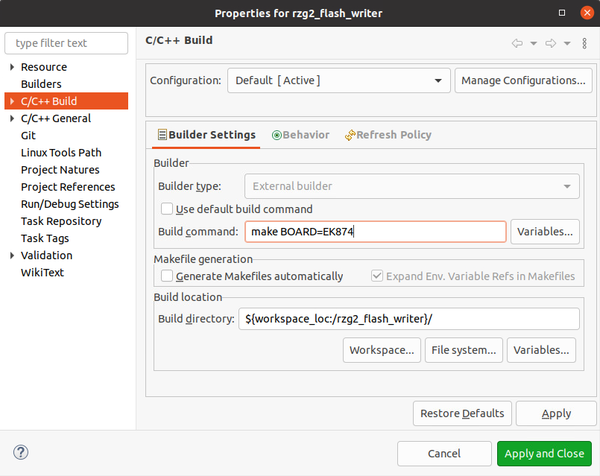
The master branch is the branch you want to use to build the Flash Writer for RZ/G2E-N-M-H. Of course you would need to setup the build environment for your target in a similar way as explained above for the RZ/G2L. Assuming you did so, we just have to make sure the correct board is selected during the build. To do so, right click on the project name -> Properties and then select C/C++ Build. Uncheck "Use default build command" and add:
- BOARD=EK874 for RZ/G2E
- BOARD=HIHOPE for RZ/G2N-M-H
You can now build, you should see the message:
========== !!! Compile Complete !!! ==========
in the Console output.
Building RZ/G2L Flash Writer
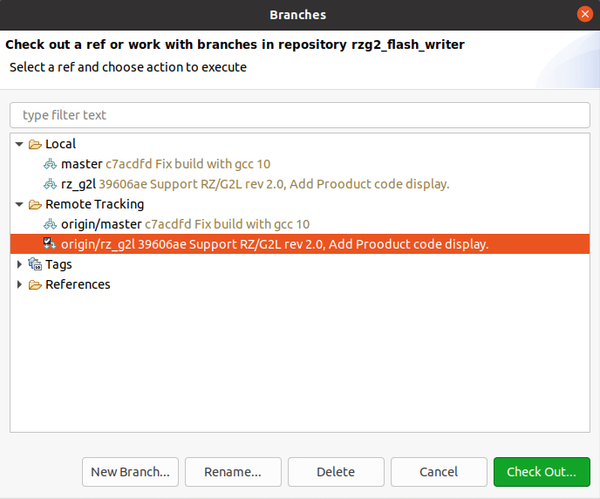
To build the RZ/G2L Flash Writer we need to checkout the corresponding branch. Right click on the project -> Team -> Switch To -> Other. Then from the "Remote Tracking" choose the rz_g2l branch, click "Check Out...":
And finally "Check out Commit". A warning about the "Detached HEAD" will appear, you can ignore and click close. Alternatively, and recommended if you want to make changes, you can "Create Branch" window appears, leave it as is and click on "Finish". We need to select the right make command, so right click on the project name -> Properties and then select C/C++ Build. Uncheck "Use default build command" and add/modify BOARD=RZG2L_SMARC_PMIC. The message
========== !!! Compile Complete !!! ==========
should appear if the build is successful. Do not forget to source the right environment variable setup script according to the board used. Please note that you would need to launch Eclipse from the terminal where the environment variables have been set.
Debugging Flash Writer using OpenOCD and dedicated plugin
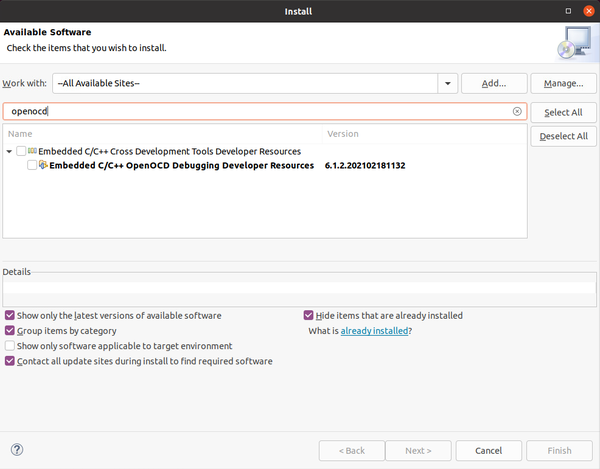
Please follow the instructions given in this page on how to set-up, build and launch OpenOCD for the RZ targets. There is a specific OpenOCD plugin but it is not installed by default with Eclipse. In order to install it, go to Help -> Install New Software. Then select "All Available Sites" and in the filter type "openocd" and hit enter.
Select the plugin and install, at the end of the installation process an Eclipse restart is required.
Right click on the project -> Debug As -> Debug Configurations, a new option should be available: "GDB OpenOCD Debugging". Create a new configuration, leave the "Main" tab with the default values and switch to the "Debugger" tab. Here is where you have to configure the link to the OpenOCD executable and the config options, as well as the right GDB executable:
Adapt to your own paths. The OpenOCD config options for RZ/G2L are:
-f /home/micbis/repos/openocd/installdir/bin/../share/openocd/scripts/interface/jlink.cfg -c "set SOC G2L" -f /home/micbis/repos/openocd/installdir/bin/../share/openocd/scripts/target/renesas_rz.cfg
Do not forget to modify the GDB executable name with the environment variable ${CROSS_COMPILE}. Then switch to the "Startup" tab and configure as per below:
Here below the Initialization Commands:
mon halt
mon r9a07g044l.a55.0 aarch64 smp off
Note: The board MUST be configured in SCIF download mode (SW11 OFF-ON-OFF-ON) and the user MUST reset the target manually every time, before a debug session is initiated (i.e. before clicking on the "bug" icon).
Make sure that also the "Continue" is checked (barely visible in the screenshot, below "Set breakpoint at").
If everything is set properly by clicking on the "bug" icon, OpenOCD is started automatically, code and symbols loaded automatically and therefore you should end up in being able to debug.
Note: Remove All Breakpoints if something unexpected happens during the launch.
Debugging Arm Trusted Firmware BL2 using OpenOCD and dedicated plugin
Similarly to Flash Writer and as much useful, Arm Trusted Firmware BL2 can be debugged using OpenOCD and the dedicated plugin. It is assumed that the plugin is already installed and the repository is already cloned, imported in Eclipse (see previous sections). To build Arm Trusted Firmware in Eclipse with the debug symbols you need to configure the custom build arguments (right click on the project -> Properties -> C/C++ Build -> Behavior tab:
And these are the build arguments specifically for RZ/G2L (no security, no OP-TEE):
PLAT=g2l DEBUG=1 BOARD=smarc_pmic_2 LOG_LEVEL=20
Also the way the debug configuration is created is identical to previous section, the only difference resides in the "Startup" tab":
Here below the Initialization Commands:
mon halt
mon r9a07g044l.a55.0 aarch64 smp off
mem 0x10000 0x2FFFF rw
rwatch -l *0x11020A00
Note: The board MUST be configured in SCIF download mode (SW11 OFF-ON-OFF-ON) and the user MUST reset the target manually every time, before a debug session is initiated (i.e. before clicking on the "bug" icon).
And the Run/Restart Commands:
delete mem 1
mem 0x10000 0x2FFFF ro
Make sure that also the "Continue" is checked (barely visible in the screenshot, below "Set breakpoint at").
It is important to highlight the importance of the rwatch -l *0x11020A00 initialization command: this configures a watchpoint on a read access to the physical address 0x11020A00, that is the LSI Mode Signal Register (SYS_LSI_MODE). The least significant three bits (STAT_MD_BOOT[2:0]) indicate the terminal state of the external terminal MD_BOOT[2:0], that are updated at the rising edge of PRST#. The RZ ATF custom code checks this bit field to determine what kind of boot mode is and configures the MPU resources accordingly. This is done in the rz_io_setup() function in the plat_storage.c file. Normally by clinking on the "go" button, if there's no other issue before, the watchpoint is hit:
Note: Remove All Breakpoints if something unexpected happens during the launch.
Since we must use the SCIF Download boot mode, the value of this bitfield will always be 5. In order to correctly debug the rest of the code, this value must be changed and adapted to the boot mode of interest:
#define BOOT_MODE_ESD           (0)
#define BOOT_MODE_EMMC_1_8      (1)
#define BOOT_MODE_EMMC_3_3      (2)
#define BOOT_MODE_SPI_1_8       (3)
#define BOOT_MODE_SPI_3_3       (4)
#define BOOT_MODE_SCIF          (5)
So the x0 register must be manually modified using the debugger to make sure the correct if branch is executed. So, for example, to simulate a boot from SD card, the value of the x0 register shall be changed from 0x10205 to 0x10200.
Debugging Arm Trusted Firmware BL31 using OpenOCD and dedicated plugin
BL31 (also known as Secure Monitor) is built along with BL2 and it can also be debugged with OpenOCD and Eclipse.
BL3x are loaded by BL2 and BL31 is the second user piece of code that is executed after BL2. So it is assumed that BL2 is working (i.e. already ported) and programmed into the boot media (QSPI, eMMC or SD) along with all other BL3x. It does not really matter if they are not completely working, it's just to ensure that something can be loaded by BL2 and the execution can be passed to the following boot stages. The idea is to let BL2 execute, load next stage bootloaders, then break at the entry point and finally load the code to be debugged into RAM.
We need to create a debug configuration for BL31, similarly to what is explained in the previous sections:
The "Continue" box is also checked (barely visible in the screenshot).
Note: The board MUST be configured in SCIF download mode (SW11 OFF-ON-OFF-ON) and the user MUST reset the target manually every time, before a debug session is initiated (i.e. before clicking on the "bug" icon).
If the boot media is QSPI, the initialization commands are:
mon halt
mon r9a07g044l.a55.0 aarch64 smp off
mem 0x0 0x2FFFF ro
hbreak *0x44000000
set $pc=0x0
rwatch -l *0x11020A00
c
set $x8=0x12003
c
set $x8=0x12003
c
set $x8=0x12003
shell sleep 1
continue
mem 0x40000000 0x4FFFFFFF rw
These commands may need a bit of explanation.
mem 0x0 0x2FFFF ro is required to make sure that the ROM and internal SRAM are treated as ro memory. GDB will then try to use hardware breakpoints to step / go / break.
hbreak *0x44000000 - this sets a hardware breakpoint at the BL31 default entry point location. Usually there is no need to change it, however the breakpoint may need to be moved if this BL31 is located somewhere else.
set $pc=0x0 - this sets the program counter back to the first location of the ROM, basically the reset vector.
rwatch -l *0x11020A00 - this command was explained in the previous section. It configures a watchpoint on a read access to the physical address 0x11020A00, that is the LSI Mode Signal Register (SYS_LSI_MODE).
c and set $x8=0x12003 repeated 3 times. In the ROM code the SYS_LSI_MODE register is read three times, each time the value read has to be modified to reflect the boot mode we are emulating, so the final 3 means QSPI 1.8V boot mode.
mem 0x40000000 0x4FFFFFFF rw - this command configures a memory page for the DDR, where the BL31 code resides.
If the boot media is eMMC/SD, the initialization commands are:
mon halt
mon r9a07g044l.a55.0 aarch64 smp off
mem 0x0 0x2FFFF ro
hbreak *0x44000000
set $pc=0x0
rwatch -l *0x11020A00
c
set $x8=0x1200n
c
set $x8=0x1200n
c
set $x8=0x1200n
c
set $x0=0x1200n
shell sleep 1
continue
mem 0x40000000 0x4FFFFFFF rw
where n = 0 for SD and n = 1 or 2 for eMMC 1.8V or 3.3V respectively. Note that in case of booting from eMMC or SD the sequence is repeated 4 times, because this is there is an additional check done in BL2.
The Run/Restart commands are:
mon r9a07g044l.a55.0 aarch64 disable_mmu
delete mem 2
mem 0x40000000 0x4FFFFFFF ro
mon r9a07g044l.a55.0 aarch64 disable_mmu - this command makes sure that the code loaded via JTAG is correctly reflected into the DDR, by cleaning / invalidating the data cache, invalidating the instruction cache and executing ISB / DSB.
mem 0x40000000 0x4FFFFFFF ro - along with the previous (delete mem 2) this ensures that HW breakpoints are used for the DDR region we are debugging. Probably not strictly required but is may be better for the stability.
Then, finally the debug session looks like:
Note: Remove All Breakpoints if something unexpected happens during the launch.
Debugging u-boot (BL33) using OpenOCD and dedicated plugin
If there's no BL32 (OP-TEE), u-boot is the code executed next.
As explained in the previous section, BL3x are loaded by BL2. It is assumed that BL2 is working (i.e. already ported) and programmed into the boot media (QSPI, eMMC or SD) along with all other BL3x. It does not really matter if they are not completely working, it's just to ensure that something can be loaded by BL2 and the execution can be passed to the following boot stages. The idea is to let BL2 execute, load next stage bootloaders, then break at the entry point and finally load the code to be debugged into RAM.
u-boot can be imported (see Flash Writer section for more details) and built using Eclipse. Assuming it is already configured properly for the target device, the toolchain is properly set up before running Eclipse, then the only configuration needed is for the custom build arguments (right click on the project -> Properties -> C/C++ Build -> Behavior tab:
Let's create the debug configuration, Main tab:
Then Startup tab:
As explained in the previous section the Initialization Commands depend on the boot media. If the boot media is QSPI they are:
mon halt
mon r9a07g044l.a55.0 aarch64 smp off
mem 0x0 0x2FFFF ro
set $pc=0x0
rwatch -l *0x11020A00
c
set $x8=0x12003
c
set $x8=0x12003
c
set $x8=0x12003
hbreak *0x50000000
continue
mem 0x50000000 0xBFFFFFFF rw
If the boot media is eMMC / SD:
mon halt
mon r9a07g044l.a55.0 aarch64 smp off
mem 0x0 0x2FFFF ro
set $pc=0x0
rwatch -l *0x11020A00
c
set $x8=0x1200n
c
set $x8=0x1200n
c
set $x8=0x1200n
c
set $x0=0x1200n
hbreak *0x50000000
continue
mem 0x50000000 0xBFFFFFFF rw
where n = 0 for SD and n = 1 or 2 for eMMC 1.8V or 3.3V respectively. Note again that in case of booting from eMMC or SD the sequence c set $x8=0x1200n is repeated 4 times instead of 3 as per QSPI boot, because this is there is an additional check done in BL2.
The Run/Restart Commands are:
restore ./.out/u-boot.bin binary 0x50000000
mon r9a07g044l.a55.0 aarch64 disable_mmu
hb relocate_code
c
shell sleep 1
symbol-file ./.out/u-boot -o gd->reloc_off
shel sleep 1
hb run_main_loop
In the Startup screenshot note that the "Load executable" flag is not checked. This is because u-boot is loaded to some location in memory and then it relocates itself.
restore ./.out/u-boot.bin binary 0x50000000 - this command loads the u-boot binary onto DDR, at location 0x50000000.
hb relocate_code - this sets a breakpoint to the relocate_code function in u-boot (symbols are already loaded).
symbol-file ./.out/u-boot -o gd->reloc_off - this command relocates the symbols to where u-boot relocates, gd -> gd->reloc_off is the offset.
hb run_main_loop - this is the breakpoint to the main loop address, where u-boot has been relocated.
Note: The board MUST be configured in SCIF download mode (SW11 OFF-ON-OFF-ON) and the user MUST reset the target manually every time, before a debug session is initiated (i.e. before clicking on the "bug" icon).
Finally, hitting the "bug" icon:
Note: Remove All Breakpoints if something unexpected happens during the launch.
Debugging u-boot SPL (Secondary Program Loader) using OpenOCD using dedicated plugin
RZ/Five does not use Arm Trusted Firmware and the first boot loader is u-boot SPL (more information here).
You can clone the u-boot repository, select the right branch and build in a similar way explained in the previous sections, the only difference is that a different toolchain is required. Assuming u-boot and u-boot SPL are built correctly, you can create a debug configuration in the same way as described before:
Project name chosen: renesas-u-boot-cip-riscv.
Config options reported here:
-f /home/micbis/renesas/repos/tools/openocd/installdir/bin/../share/openocd/scripts/interface/jlink.cfg -c "set SOC G2L" -f /home/micbis/renesas/repos/tools/openocd/installdir/bin/../share/openocd/scripts/target/renesas_rz_five.cfg
And finally startup tab:
Initialization Commands:
mon reset
mon halt
mem 0x10000 0x2FFFF rw
Run/Restart Commands:
restore .out/spl/u-boot-spl.dtb binary &__binman_sym_start
delete mem 1
mem 0x10000 0x2FFFF ro
mon mww 0x10000 0x1
There's an important difference here to highlight compared to Arm Trusted Firmware BL2. Since u-boot-spl (elf file) does not include the device tree blob (u-boot-spl.dtb), it needs to be downloaded to memory explicitly at a specific memory location, the address of the __binman_sym_start symbol.
The last command in the Run/Restart is meant to simulate the value that the boot ROM writes at 0x10000 SRAM location, reading the BOOT_SELn pins configuration at startup (refer to the table in the previous section).
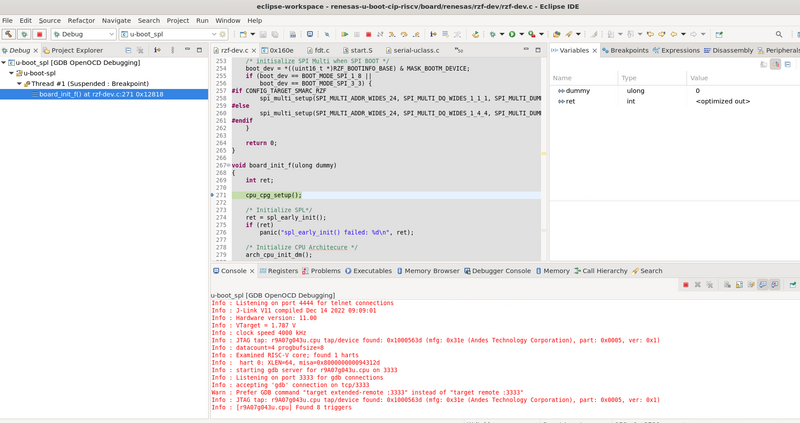
Once saved, if everything goes fine, u-boot-spl can be debugged by clicking on the bug icon in Eclipse, leading to something similar to the following screenshot:
Secondary cores cross developing and debugging
The RZ/G2 family includes a secondary, real-time core. The RZ/G2L include a Cortex-M33 whereas RZ/G2E-N-M-H include a Cortex-R7. You can use Eclipse to develop and debug also for these cores. Debugging is a little tricky because the secondary core cannot boot independently, rather it relies on the main core to load the firmware and boot. However the idea behind does not change much, you need to setup a development environment for the Cortex-M/R (e.g. arm-none-eabi-gcc ) and use the corresponding GDB to debug (arm-none-eabi-gdb). GDB connects to the OpenOCD port dedicated to the secondary core. You can also develop and debug both main cores and secondary cores at the same time, using two Eclipse instances.
Cortex-M33 developing and debugging
First of all it is important to notice that the official RZ/G2L Cortex-M33 development and debugging environment is e2studio. Therefore the instructions provided here most likely are not relevant. However, this section is meant to show that OpenOCD can be used as well, for the sake of completeness.
In order to develop and debug for the Arm-v8M (and Arm-v8R) you need to install another GCC toolchain. It can be downloaded from the Arm developer website. The Linux x86_64 Tarball is what you want to download and untar in the folder you like, for example:
tar -xvf gcc-arm-none-eabi-10-2020-q4-major-x86_64-linux.tar.bz2 -C /opt/arm/
then add the bin directory to the path and export the cross compile environment variable:
PATH=/opt/arm/gcc-arm-none-eabi-10-2020-q4-major/bin:$PATH ; export CROSS_COMPILE=arm-none-eabi-
Download the Cortex-M33 sample code (simple LED blink example) from here.
Now you can start Eclipse:
eclipse &
It may be convenient to create a workspace for Cortex-M and keep it separated from the Cortex-A. This is useful to have the possibility to potentially run two different Eclipse instances.
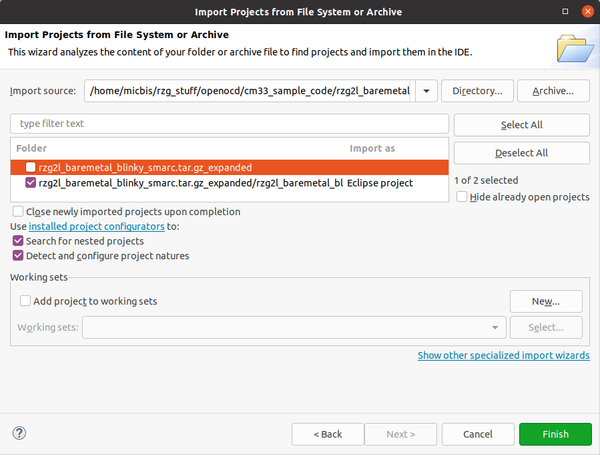
Import the blinky project in the newly created workspace: File -> Import -> General -> Projects from Folder or Archive. Select the archive file downloaded previously by clicking on Archive. Deselect the top of the two projects displayed and click Finish:
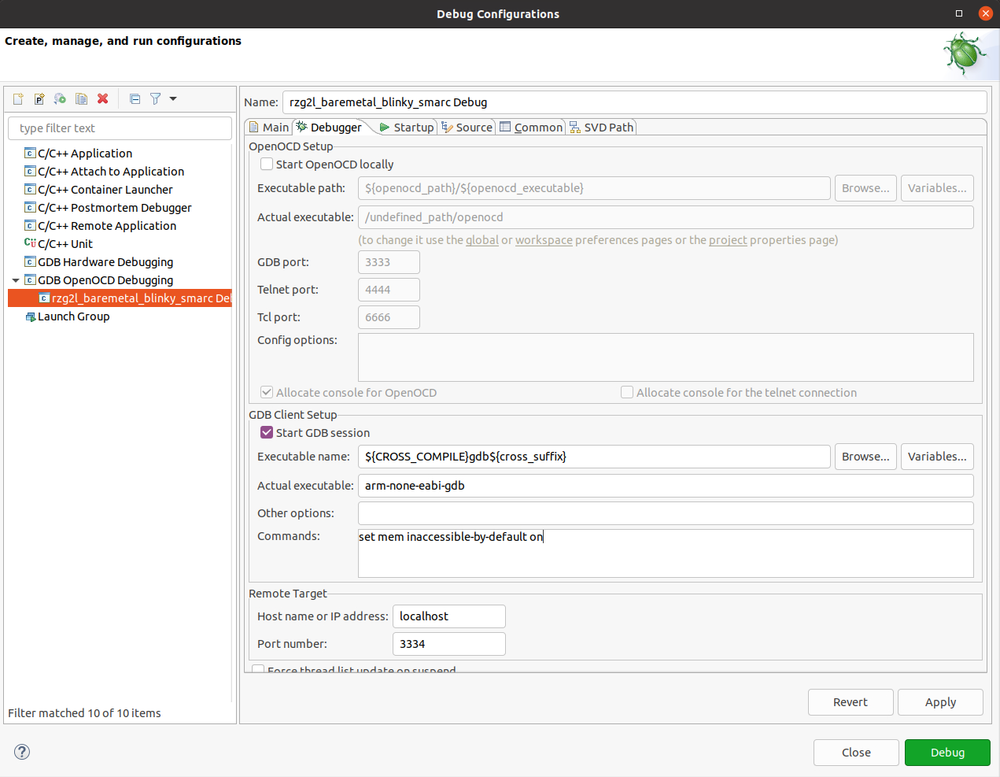
You should be able to build the project without errors (33 warnings). You have to create a debug configuration, right click on the project, Debug As -> Debug Configurations. Select GDB OpenOCD Debugging (you need the OpenOCD plugin as per previous section) and create a new debug configuration by clicking on the leftmost icon. Leave the "Main" tab as per default and switch to the "Debugger" tab. You may want to deselect "Start OpenOCD locally", since OpenOCD will be started manually. Then in the "GDB Client Setup" part use the ${CROSS_COMPILE} as prefix, change the port number to 3334 and finally change the command (important) "set mem inaccesible-by-default" to "on" :
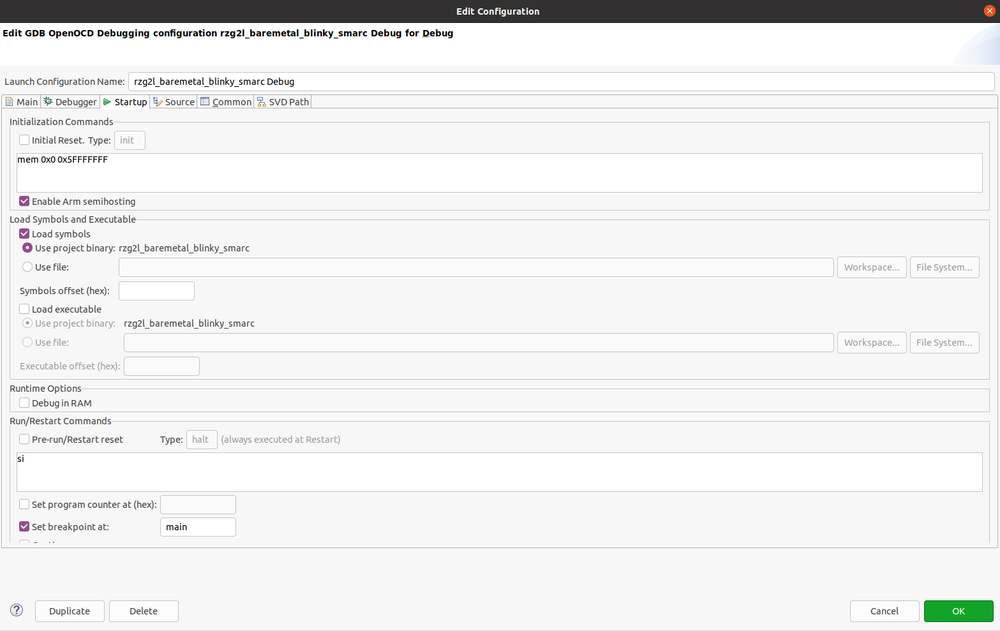
Move to the Startup tab and modify the fields as per below:
Do not click on Debug, just save and close, it is time to launch OpenOCD "manually" and load the Cortex-M33 binary via Cortex-A55.
As you have probably noticed reading this part of the OpenOCD guide, OpenOCD starts two gdb servers, one for the dual Cortex-A55 (SMP) and another for the Cortex-M33. However as already mentioned the Cortex-M33 is not independent and it has to be started by the Cortex-A55. Let's do it "manually", i.e. starting first OpenOCD and GDB in the terminal and not via Eclipse. From the folder where OpenOCD binary is installed:
./openocd -f ../share/openocd/scripts/interface/jlink.cfg -c "set SOC G2L" -f ../share/openocd/scripts/target/renesas_rz_g2.cfg
Before launching GDB, download this script and modify the binary path according to your own, This is the binary generated by Eclipse previously, normally in the workspace / project name / Debug folder. Tip: in Eclipse you can easily copy the executable path by right clink on the executable itself -> "Show in local terminal".
Then open another terminal:
source /opt/poky/3.1.5/environment-setup-aarch64-poky-linux
$GDB
GNU gdb (GDB) 9.1
Copyright (C) 2020 Free Software Foundation, Inc.
License GPLv3+: GNU GPL version 3 or later <http://gnu.org/licenses/gpl.html>
This is free software: you are free to change and redistribute it.
There is NO WARRANTY, to the extent permitted by law.
Type "show copying" and "show warranty" for details.
This GDB was configured as "--host=x86_64-pokysdk-linux --target=aarch64-poky-linux".
Type "show configuration" for configuration details.
For bug reporting instructions, please see:
<http://www.gnu.org/software/gdb/bugs/>.
Find the GDB manual and other documentation resources online at:
    <http://www.gnu.org/software/gdb/documentation/>.

For help, type "help".
Type "apropos word" to search for commands related to "word".
(gdb)
and launch the script by giving the command:
source ~/rzg_stuff/openocd/gdb_smarc_g2l_blinky_ca55_load
The script executes all the needed steps to load the code and wake the Cortex-M33 up. If successful you should get:
JTAG scan chain interrogation failed: all ones
Check JTAG interface, timings, target power, etc.
Trying to use configured scan chain anyway...
r9a07g044l.cpu: IR capture error; saw 0x0f not 0x01
Bypassing JTAG setup events due to errors
Invalid ACK (7) in DAP response
JTAG-DP STICKY ERROR
Deferring arp_examine of r9a07g044l.a55.1
Use arp_examine command to examine it manually!
Deferring arp_examine of r9a07g044l.m33
Use arp_examine command to examine it manually!
Invalid ACK (7) in DAP response

Debug regions are unpowered, an unexpected reset might have happened
JTAG-DP STICKY ERROR
Polling target r9a07g044l.a55.0 failed, trying to reexamine
DAP transaction stalled (WAIT) - slowing down
DAP transaction stalled during replay (WAIT) - resending
DAP transaction stalled (WAIT) - slowing down
r9a07g044l.a55.0: hardware has 6 breakpoints, 4 watchpoints
r9a07g044l.a55.0 halted in AArch64 state due to debug-request, current mode: EL3H
cpsr: 0x400003cd pc: 0x3aac
MMU: disabled, D-Cache: disabled, I-Cache: enabled
Loading section .text, size 0x18ec lma 0x10000
Loading section .data, size 0x58 lma 0x1e000
Loading section .secure, size 0x268 lma 0x1f400
Start address 0x000000001001f5ed, load size 7084
Transfer rate: 7 KB/sec, 2361 bytes/write.
0x11020504: 00000000

0x11020d28: 00001100

0x11010984: 00000000

DAP transaction stalled (WAIT) - slowing down
DAP transaction stalled during replay (WAIT) - resending
DAP transaction stalled (WAIT) - slowing down
DAP transaction stalled during replay (WAIT) - resending
DAP transaction stalled (WAIT) - slowing down
DAP transaction stalled (WAIT) - slowing down
DAP transaction stalled (WAIT) - slowing down
DAP transaction stalled (WAIT) - slowing down
DAP transaction stalled (WAIT) - slowing down
DAP transaction stalled (WAIT) - slowing down
DAP transaction stalled (WAIT) - slowing down
DAP transaction stalled (WAIT) - slowing down
DAP transaction stalled (WAIT) - slowing down
DAP transaction stalled (WAIT) - slowing down
DAP transaction stalled (WAIT) - slowing down
DAP transaction stalled (WAIT) - slowing down
r9a07g044l.m33: hardware has 8 breakpoints, 4 watchpoints
r9a07g044l.m33: external resume detected
 hard_err: catch
  int_err: catch
  bus_err: catch
state_err: catch
  chk_err: catch
 nocp_err: catch
   mm_err: catch
    reset: catch

target halted due to breakpoint, current mode: Thread
xPSR: 0xf9000000 pc: 0x1001f5ec msp: 0x3001fa00
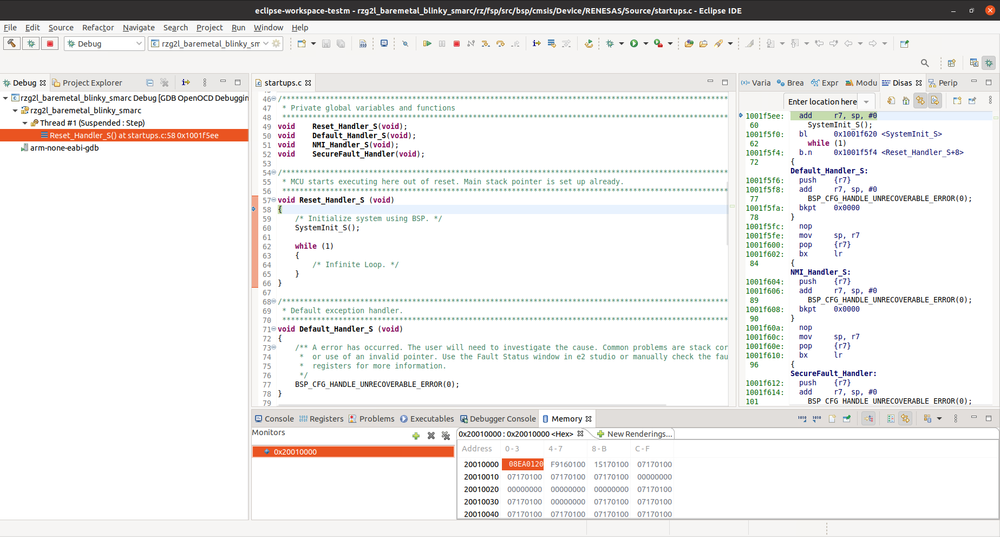
Now the Cortex-M33 is stopped at the secure reset vector, you can switch to Eclipse again and click on the debug icon to connect to the Cortex-M33 OpenOCD gdbserver:
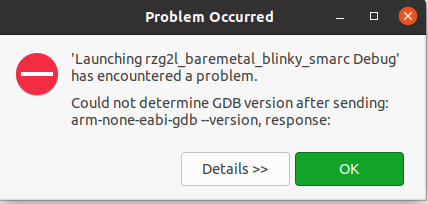
Note: If you get error below while launching eclipse, make sure libncurses5 and libncursesw5 are installed in your system.
sudo apt-get install libncurses5 libncursesw5
Please note that there are no user LEDs on the SMARC board. In order to see a LED blinking you would need to add an external PMOD LED board, for example this one, to the PMOD0 connector of the carrier board.
Cortex-R7 developing and debugging
To do.
Kernel Debugging with Eclipse and OpenOCD
It is possible to use OpenOCD and Eclipse to source level debug the Linux kernel. This means kernel space (device drivers), not application space. For application space, you need to use traditional gdb, not JTAG. The reason is that Linux applications run in virtual address space, so the settings of the MMU must be considered. However, while the Linux kernel also runs at a virtual address, the address space is fixed so it is possible to use openOCD and JTAG.
General Considerations:
Here are some considerations to think
- The JTAG can only break and control CPU core 0. If you use a multi-core system, you must disable all other cores.
- This works best for debugging device drivers on bootup.
- Please make and install the Yocto SDK because we will need to use the gdb from that SDK.
Kernel Build Options:
You must build the kernel with the following configuration options. Not that =y means they must be enabled, and =n means they just be disabled. Please use menuconfig to confirm each one.
- CONFIG_DEBUG_INFO=y
- CONFIG_DEBUG_INFO_REDUCED=n
- CONFIG_DEBUG_INFO_SPLIT=n
- CONFIG_RANDOMIZE_BASE=n
- CONFIG_UNMAP_KERNEL_AT_EL0=n
To debug modules:
- CONFIG_KALLSYMS=y
Kernel Boot Arguments:
You need to add the follow to your kernel boot arguments:
- nohlt pti=0 maxcpus=1
GDB init script:
- Create a script file 'gdb_g2l_kernel' with the contents below. This script will get run by eclipse.
# This script is meant to debug the RZ/G2L kernel

# Connect to OpenOCD
# If the script is launched from GDB command line then the next line shall not be commented out
# In Eclipse it is not needed since the connection is attempted by Eclipse itself
#target remote localhost:3333

set confirm off

mon reset
mon halt
shell sleep 0.5

# Disable SMP
mon r9a07g044l.a55.0 aarch64 smp off
shell sleep 0.5

# Add DDR memory region
mem 0x40000000 0xBFFFFFFF ro

# Add kernel DDR memory region
# Set at Read-only to force only HW breakpoints
mem 0xffff800010000000 0xffff80001fffffff ro

# Set a temporary breakpoint at function start_kernel().
# You can remove this
thbreak start_kernel

continue
Board Setup:
- You boot the board normally into u-boot. The start script will set a hardware breakpoint in start_kernel for you, so Eclipse will automatically stop on boot.
Eclipse Project:
- Create a new "Makefile Project with Existing Code"
- Browse to the base of you kernel source code.
Eclipse Debugger Configuration:
- Create a new 'GDB Hardware Debugging' Configuration
- Fill in the tabs as follows:
[Main]
Project: rz_linux_cip
C/C++ Application: /home/renesas/rzg/rzg2l/build_scripts/rz_linux-cip/.out/vmlinux
[x] Disable auto build

[Debugger]
[Debugger][GDB Setup]
GDB Command: /opt/poky/3.1.17/sysroots/x86_64-pokysdk-linux/usr/bin/aarch64-poky-linux/aarch64-poky-linux-gdb

[Debugger][Remote Target]

Use Remote target
[x] User remote target
[ ] Remote timeout (seconds):
JTAG Device: [ OpenOCD (via socket) ]
GDB Conenciton String: [ localhost:3333 ]
[ ] Force thread list update on suspend


[Startup]
[Initialization Commands]
[x] Reset and Delay (seconds) 1
[ ] Halt
----------------------------------------------------------
| source gdb_g2l_kernel                            |
----------------------------------------------------------

[Load Images and Symbols]
[ ] Load images
[X] Load symbols
(o) Use project binary: xxxxxxxxxxxxxx
( ) Use File:

Run Commands
[ ] Set program counter at (hex)
[ ] Set breakpoint at:
Eclipse Considerations:
- The 'Step Over' button does not work well. But, you can use 'Run to Line' which works well.
- The 'Step Into' button does not work well. However, if you enable the 'Instruction Stepping Mode', then the 'Step Into' button does work because then it will use the 'si' gdb command and step each assembly instruction (as opposed to C instruction which requires a breakpoint) one at a time. In that case, you can watch each step operation in the Disassembly window.


